

Written by Atul Gupta, Analytics Manager — LUS Support Ops, Lyft
At Lyft, getting operators and riders connected quickly and reliably depends on more than technology — it depends on the teams working behind the scenes to keep that technology running smoothly. For the operators managing Lyft’s fleet across markets, having fast, reliable access to support is what keeps bikes on the road, stations stocked, and issues resolved before they affect riders. Building the infrastructure that makes that support possible is what our team does; this is the story of how we built it.
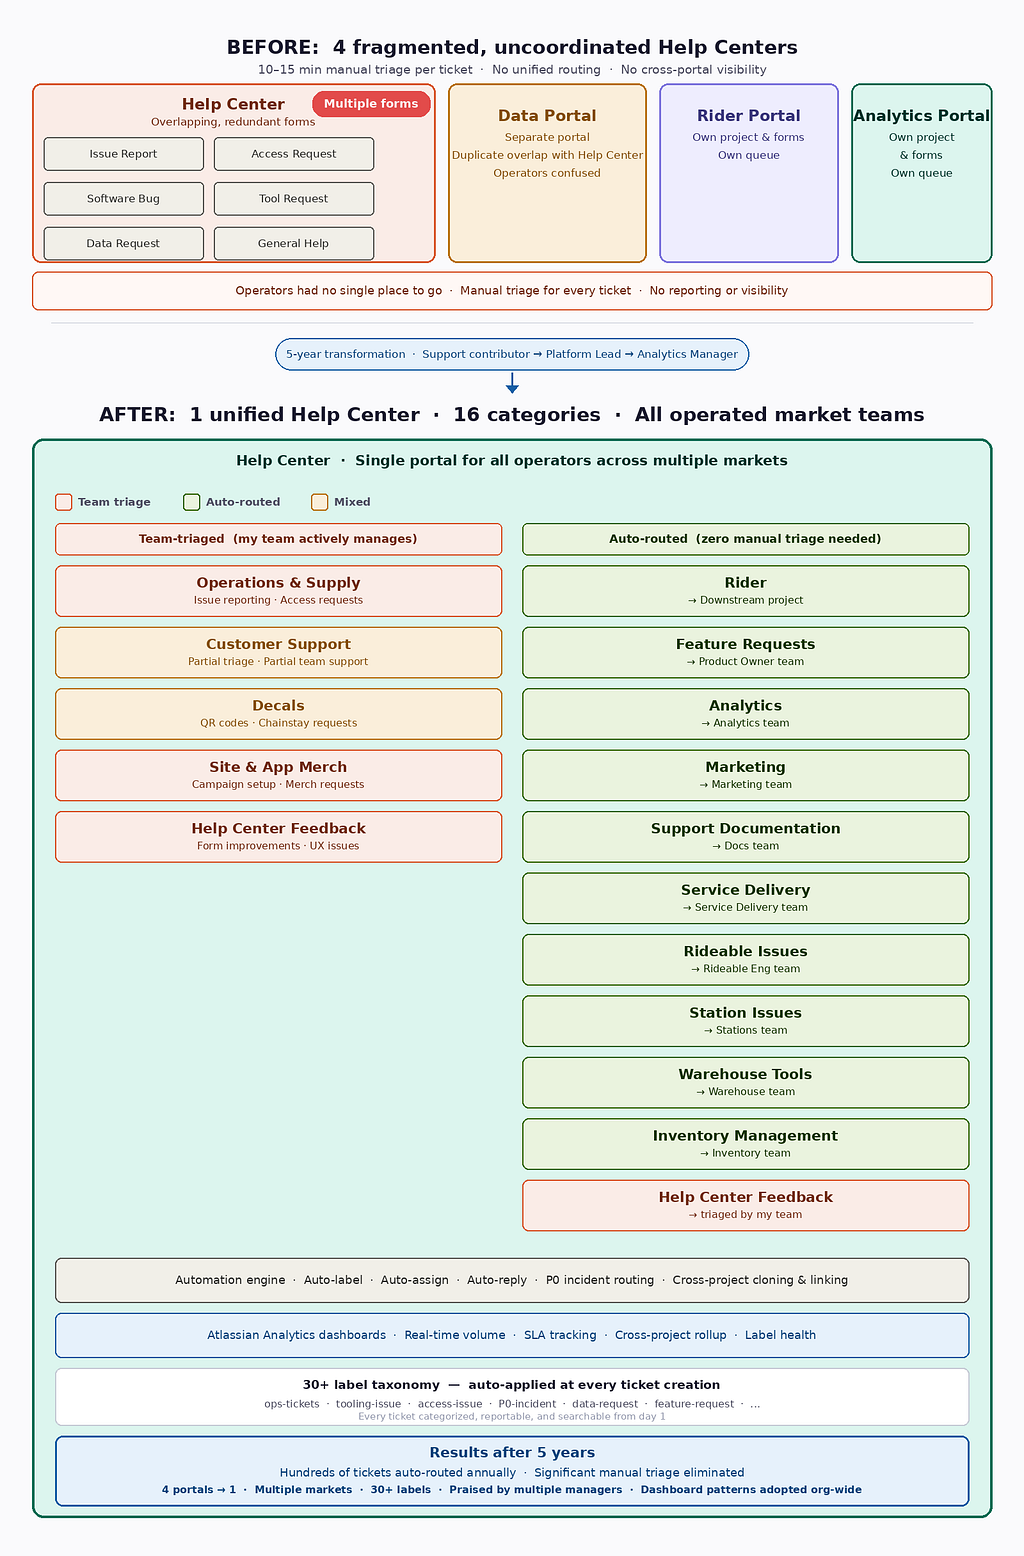
When I first joined Lyft Urban Solutions’ (LUS) Support Ops team in 2020, ticketing processes for our operators were still being established. There was no reliable way to raise issues, track progress, or get routed to the right person. We had a Jira Help Center, but it had become increasingly difficult to navigate.
What followed was a five-year journey of transforming that chaos into a streamlined, automated, self-routing system that now handles thousands of tickets per year, with one third of those routed automatically — saving hours of manual triage work annually.
The Problem: Organic Growth Gone Wrong
On the surface, a Jira Help Center sounds like a reasonable solution. In practice, ours had become a maze. Here’s what we were dealing with:
- Duplicate intake forms doing the same job under different names
- Redundant categories with no clear ownership
- Forms that didn’t capture the right information upfront, forcing follow-up back-and-forth
- No auto-labeling, so tickets couldn’t be searched or reported on
- No routing logic — every ticket needed a human to read it and manually assign it
- No dashboards — leadership had zero visibility into ticket volume or trends
With this system, tickets would’ve taken the team 10–15 minutes to manually triage. It was time to redesign the system.
Phase 1: Restructuring
Before building anything new, we had to tear down what wasn’t working. I started by auditing every intake form in the portal. I found forms that hadn’t been used in years sitting alongside forms that overlapped almost entirely in purpose.
Cleanup started in one of our Help Centers, we consolidated redundant intake forms into smarter, dynamic forms. But this was only the beginning. Over time, the Help Center grew far beyond operation support. Today it serves multiple categories spanning all Lyft Urban Solutions operated market teams, which includes operations, field support, data, marketing, engineering and more. The key tool that made this scalable was Jira’s Proforma, a form builder that lets you create conditional branching logic within a single intake form, capturing the right information for each category without overwhelming the submitter.
Instead of having separate forms for each issue category, we created a single dynamic form with an “Issue Type” dropdown. Depending on what the operator selected, different fields would appear and only ask for information relevant to that issue type. This same pattern was then applied across all categories as the Help Center expanded.
This eliminated confusion immediately. Operators no longer had to decide which of three similar-looking forms to use. There was one form and it asked the right questions.
Phase 2: Automating
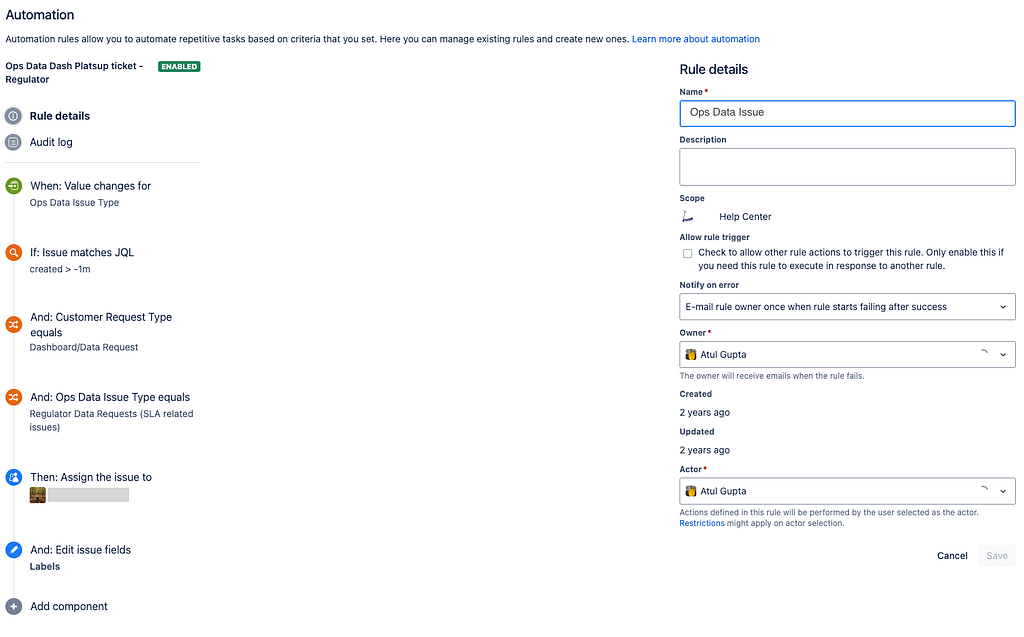
With cleaner forms in place, we could now build the intelligence layer on top. Jira automations became the backbone of this system.
Automatic ticket routing was the first win. Using the data captured in our Proforma fields, we set up automation rules that would:
- Auto-assign tickets to the right team member based on issue type and sub-category
- Add the correct label (from our 30+ label taxonomy) the moment a ticket was created
- Send automated acknowledgment replies to reporters so they knew their ticket was received
- Trigger PagerDuty alerts for P0 incidents, routing to the correct on-call engineer based on the specific incident type selected in the form
The PagerDuty integration deserves a special mention. Previously, when a P0 blocker occurred — for example, the app going down for 5+ operators — the reporter would submit a ticket, a human would read it, identify which engineer was on call for that issue type, and then page them. That chain of manual steps added critical minutes during an active incident.
Now, when an operator selects “P0 Operating Software Incident” and specifies the incident type, the system automatically pages the right on-call engineer. There are no humans needed for an initial escalation.
Additionally, we implemented an automation that comments on and automatically closes a ticket if the user creates a P0 ticket utilizing a standard form or subsequently attempts to elevate that existing form to a blocker priority. This was essential because a regular ticket with blocker priority does not trigger an alert to an on-call engineer.
A significant portion of tickets per year now route automatically. At 10–15 minutes saved per ticket, multiple hours of manual triage work are eliminated annually.
Phase 3: Consolidating
As my role at Lyft evolved — from Support Contributor to Platform Support Lead to Analytics Manager — so did the system’s scope. We were asked to absorb ticketing workflows from other teams, each of whom maintained their own separate portals. From an operator’s perspective, this was a nightmare as they had to navigate multiple portals.
My goal was to make our Help Center the single entry point for all LUS operated market support requests, regardless of which backend team actually owned the work.
The technical challenge: each team’s work lived in a different Jira project. We couldn’t just redirect tickets because the work still needed to live in the right project for each team’s reporting and workflows.
The solution was a combination of ticket cloning and auto-linking automation:
- Operator submits a ticket through our unified portal
- An automation detects the issue type and determines which project it belongs to
- A clone of the ticket is automatically created in the correct downstream project
- Both tickets are automatically linked to each other
- The original ticket is updated with an automated comment pointing the reporter to the downstream ticket for future updates
This meant operators only needed to know one place to go. The routing to the right team happened invisibly and automatically.
We also deprecated the three other Help Centers, reducing operator confusion and eliminating the maintenance burden of keeping four separate portals up to date.
Building Visibility with Jira Structures
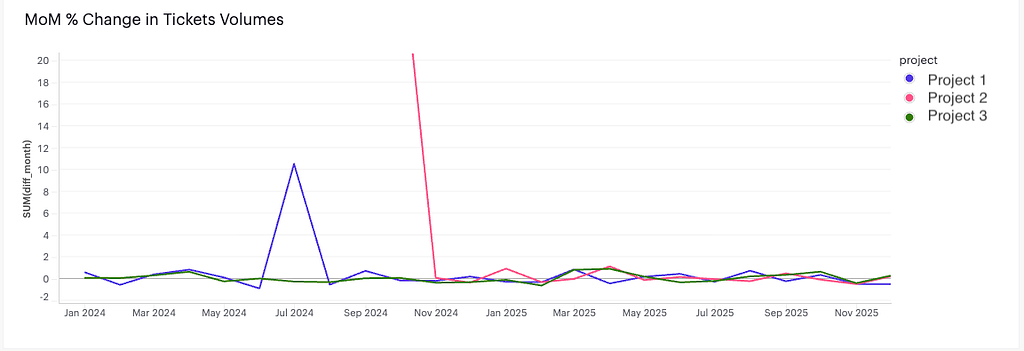
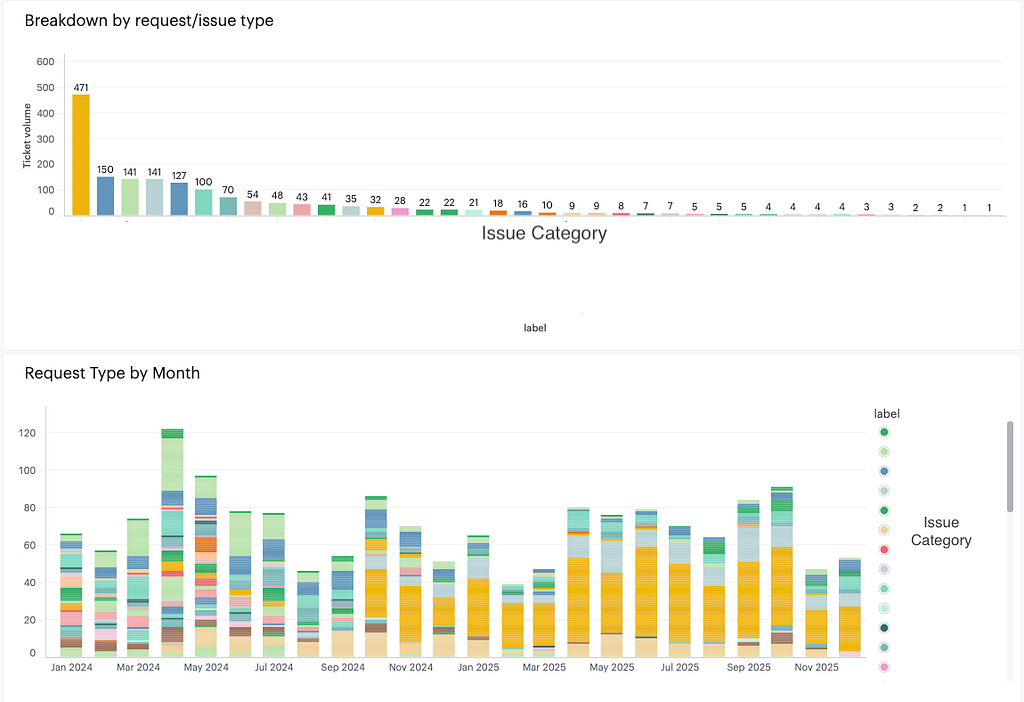
The final piece was dashboards. Visibility into ticket data was limited — ticket volumes, team workload, and trends were difficult to track across the system. Our team couldn’t easily track which label categories were spiking or which markets were generating the most issues.
Standard Jira dashboard widgets are limited. They handle basic counts and simple filters, but they can’t do things like show a hierarchical breakdown of tickets by label category, or display cross-project rollups in a single view.
Jira Structures gave us the ability to build those advanced views. We created:
- An operational overview dashboard showing real-time ticket distribution across teams and categories
- A P0 incident tracker with SLA monitoring
- A cross-project rollup showing all tickets regardless of which downstream project they lived in
- A quality tracker showing tickets missing required labels, which helped enforce labeling discipline across the team
But we didn’t stop there. For deeper analytics — the kind needed to power Monthly Business Reviews and spot longer-term trends — we built an additional reporting layer by connecting our Help Center ticket data to Mode via a Jira ETL pipeline. This unlocked richer querying and custom visualizations that weren’t possible with native widgets, including breakdowns by market, category-level volume trends over time, and SLA performance across teams. This all lived in one place and was accessible to leadership without them needing to log into Jira at all.
What We Learned
Four lessons from this build that might be useful if you’re tackling something similar:
- Design for the submitter, not the triage team. The instinct when building intake forms is to ask for everything that would be useful for an investigation. Resist this. Operators filling out forms are often in the middle of an operational situation — they want to submit quickly and get help. Ask only what’s truly necessary to route and resolve the ticket.
- Automate the boring triage, not the nuanced triage. Jira automations are excellent at routing “if issue type = X, assign to person Y” style decisions. However, they’re not a replacement for human judgment on complex, multi-symptom issues. The goal is to free up your team for the work that actually requires expertise.
- Labels are a data model. When we built our label taxonomy with 30+ labels across business areas, we were really building a reporting schema. Treat labeling as seriously as you’d treat database schema design, because the quality of your reporting entirely depends on it.
- Consolidation is a forcing function for alignment. Merging four Help Centers into one required us to have conversations with four different teams about ownership, priorities, and workflows. Those conversations would have been valuable regardless — the consolidation project just gave us a reason to have them.
The Results
Over five years, the team consolidated four Help Centers into one, built a 30+ label classification system, and created a system that now serves multiple operated LUS markets. A significant portion of all incoming tickets route automatically with no manual triage needed.
Beyond metrics, this system changed how our team operates. We spend less time as ticket routers and more time as analysts. The operators we serve get faster responses and clearer ownership. We improved leadership visibility into ticket data so they also understand where support demand is growing.
If you’re building or inheriting a support ops system and dealing with the same kind of organic sprawl we had, I hope this gives you a playbook. All the tools: Jira Proforma, automations, Structures are accessible. The hard part is the design thinking that has to come before you touch any of it.
What’s Next: Migrating to Atlassian Cloud
This story doesn’t end here. Later this year, Lyft is migrating from Jira Server to Jira Cloud — and that migration brings a new chapter of challenges and opportunities for everything we’ve built.
What we’re currently navigating:
Jira Structures is being discontinued. The advanced dashboarding layer we built — the cross-project rollups, the SLA monitors, the label health trackers — was powered by Jira Structures, which Atlassian is not carrying over to Cloud. Every dashboard we’ve built needs to be rebuilt from scratch.
The Mode ETL pipeline is going away. Beyond Jira Structures, we also built a set of deeper analytical dashboards by piping Jira ticket data into Mode via an ETL pipeline. This allowed us to run richer queries, build custom visualizations, and power our Monthly Business Reviews with live ticket data — things that weren’t possible with native Jira widgets alone. The Jira-to-Mode ETL pipeline will be discontinued post-migration. We’re exploring cloud-native analytics tools. We’ll be rebuilding our reporting suite there — which is both a challenge and an opportunity to consolidate everything into one tool rather than maintaining two separate dashboarding layers.
PagerDuty integration needs reconfiguration. The PagerDuty services we set up to auto-page on-call engineers for P0 incidents don’t migrate automatically. We’ll need to manually reconfigure every integration in the new Cloud environment.
API and bot updates are required. Any Jira bots and integrations — including our Boomi integration — will need to be updated to use Jira Cloud’s new REST API v3. This is a meaningful engineering effort that needs to be coordinated carefully to minimize downtime.
Proforma intake forms need validation. The dynamic intake forms at the heart of our routing system are built on Proforma, which does exist in Jira Cloud — but all forms will need to be reviewed and tested to confirm they migrate cleanly and all conditional logic survives the transition.
Atlassian Analytics is more powerful than Jira Structures for reporting purposes. The forced rebuild is a chance to design dashboards that are better than what we had.
The migration is scheduled for later this year. The same principles that guided the original build — design intentionally, automate the boring work, consolidate rather than sprawl — will guide the rebuild.
After five years, the system looks nothing like what it started as and that’s the point. A good team keeps finding ways to make things better.
Lyft is hiring! If you’re passionate about building scalable support systems, automating operational workflows, and analytics that drive real decisions — visit Lyft Careers to see our open roles.
From Chaos to Clarity: How We Built a Unified, Self-Routing Support Ops Ticketing System at Lyft was originally published in Lyft Engineering on Medium, where people are continuing the conversation by highlighting and responding to this story.
